Tony season is coming up, and as a theater kid, I am ecstatic. For those who don’t spend their time destroying their hearing by blasting show tunes into their eardrums, the Tony awards are basically the Oscars for Broadway, an entire night dedicated to recognizing the talented actors and production members who allowed for the year’s new musicals to come to life. These awards are very prestigious and sometimes mean the difference between a show shutting down and going on to become a Broadway classic. It is every thespian’s dream to win one of these awards, and that’s where I come in. Say you are in a situation where you need to win a Tony, essentially the reverse of “The Producers”. If you wanted to make a musical for the sole purpose of winning the esteemed Best Musical award, how would you go about doing it? That is what I wanted to find out.
Let’s start with the basics; how does one figure this out? Well, I decided to look at each show that has won Best Musical and see if there are any trends in the data. Because I value what little is left of my sanity, we’re just going to look at Tony-winning musicals from the years 2000-2023, also that time range shows the most accurate numbers currently, unlike if we were to examine shows from a decade like the 1980s. Something tells me that you readers don’t want to build a time machine just to try and beat “Cats” for a Tony. We will be looking at 14 different variables:
- Whether the show is an original show or if it is an adaptation of another story
- How many Tonys the show won
- The creators of the show
- The show’s budget
- How many performances the show had
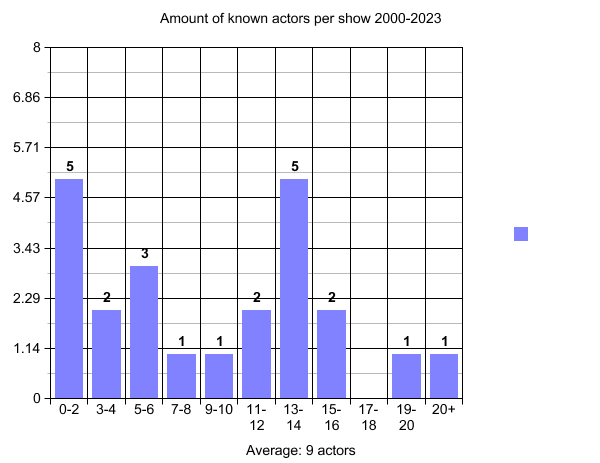
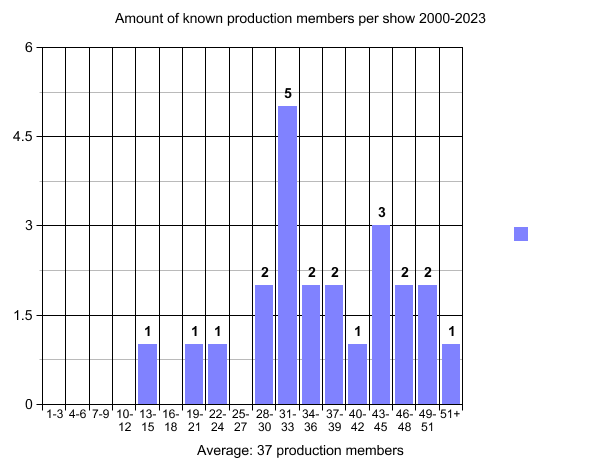
- The number of known actors and production members a show has
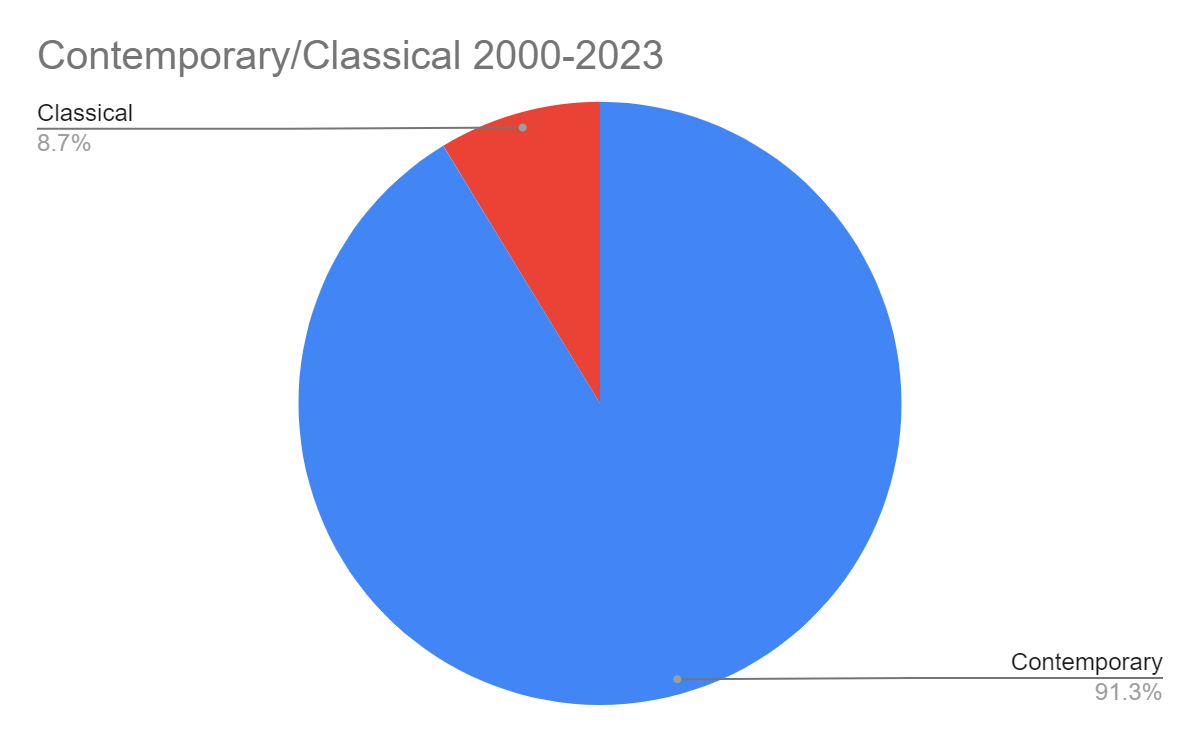
- If a show is classified as contemporary or classical
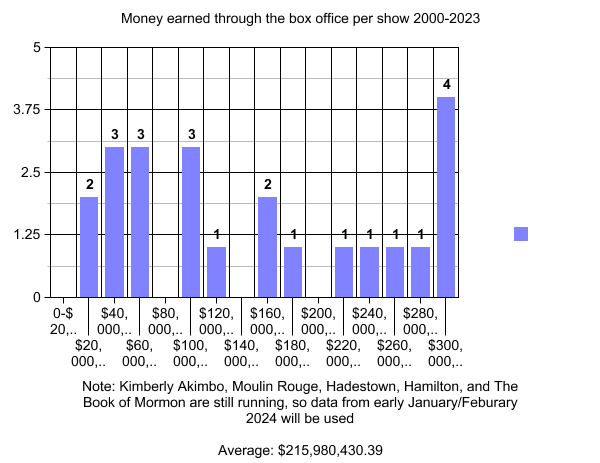
- How much money a show earned through the box office
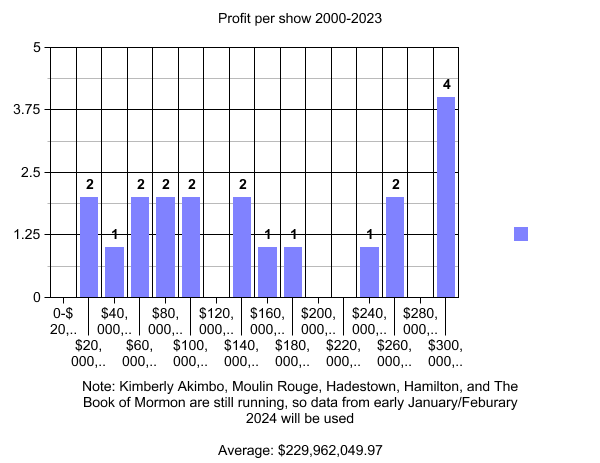
- The profit of a show
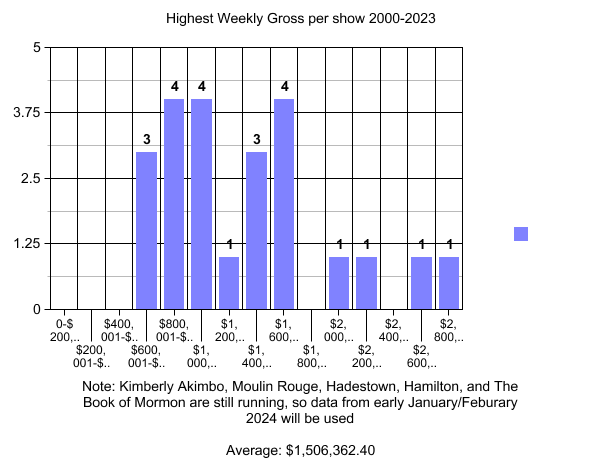
- The show’s highest weekly gross
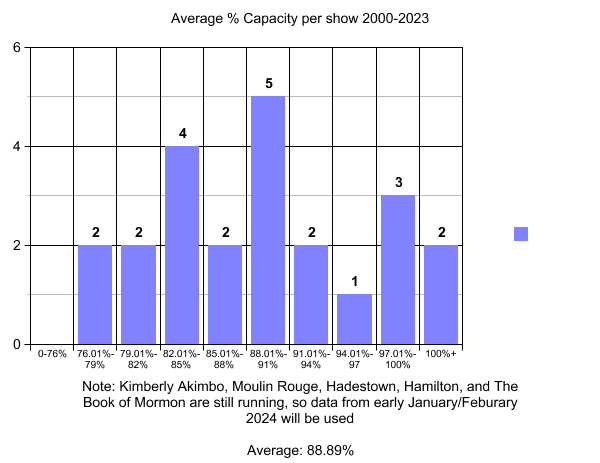
- The show’s average audience capacity
- The themes of a show
- The stars of a show
Remember when I said I valued my sanity? Forget that. If any of my teachers are reading this, you now know why I look so tired. But, I am determined to find this out, so let’s keep going. First, though, let me address a few things. Statistics like themes and who are the stars of the show are very much judgment-based. While I did do research to figure out what the themes were for each show, it can vary based on who you ask, and the same goes for who are considered the stars of each show. Secondly, I’m sure many of you are wondering how I am going to determine if an actor or production member is “known.” While it is not a perfect science, I decided early in the process that an actor or production member would count toward the total number if, as of 2024, they have had 10 or more jobs on Broadway.
To start, I made several spreadsheets–one for the shows from 2000-2009, one for the shows from 2010-2019, one for the shows from 2020-2023, and one that had all of the shows in it. This last spreadsheet is the one we will use the most for graphs. With those done, and hours of my life lost staring at the bright neon yellow heading of Playbill.com, I made each of the individual variables into their own graphs from the master spreadsheet. Now, before anyone realizes that I just spent all my free time in the last three months making graphs and that’s probably why I’m not invited to parties, what do these graphs tell us?
For the third variable, creators of the show, a graph would be very long and with almost no trends, thanks to the number of different people who created the shows that went on to win Best Musical . Although I did say almost no trends, not no trends. I was able to find three names that each appeared twice–Lin Manuel-Miranda, Jeanine Tesori, and Robert Lopez. While this data does not show us much, if there were a trend it would show that audiences tended to sway more toward one composer or author.
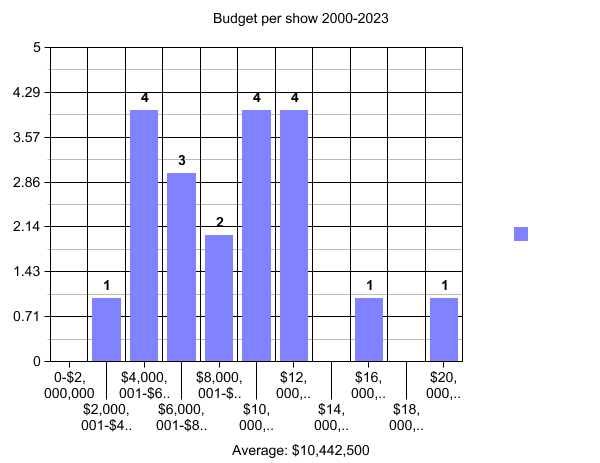
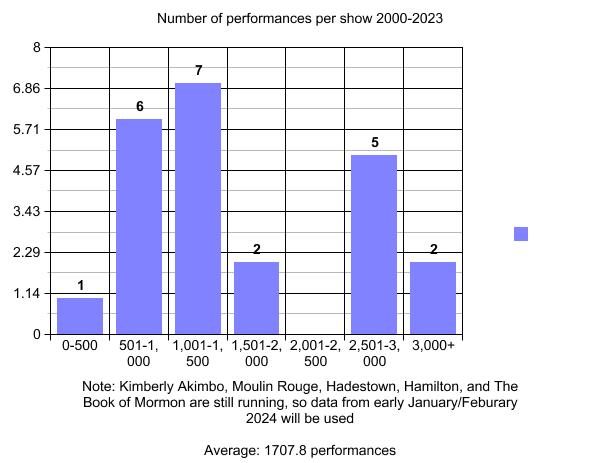
Quick note before we go forward with the next graph. Since our fifth variable is how many performances each show had during its run, that then causes the issue that several of these shows are still running, or were still running during the time I recorded this data. This also applies to a few of our other variables, including profit-related variables, along with highest weekly gross and average theater capacity. So these data points for “Kimberly Akimbo,” “Moulin Rouge,” “Hadestown,” “Hamilton,” and “The Book of Mormon” are from early January and February. Anyway, back to what people are here for-graphs for a topic no one asked me to cover.
When it came to themes, there was a lot of variety between each of the shows, but I managed to make six categories for them. The first category was human connection, so basically anything that had to do with relationships between people. The second was what I ended up naming human desires, so themes like dreams, success, and freedom fall under this category. The third was complex topics, because while shows often had general themes that could be summed up in one word, sometimes they were more specific and were ideas that could create discussion, like what it is like to be human (which was one of the themes listed). The fourth was politics, with themes in the category like democracy and immigration. The fifth was identity, which a lot of themes fell under. And finally, the sixth category was death, for themes like grief, loss, and mortality. When I analyzed the data, most shows had identity and/or human connection-related themes.
And now, readers, we have come to our final variable, and luckily for you and for my sleep schedule, it’s a short one. This is looking at the one or two leading actors in a show and seeing if we can find any patterns. When it comes to if there is one or a few actors that keep popping up, just like our music, lyrics, and book writers, there really isn’t anyone that appears more than once. Well, except for our good pal Lin Manuel-Miranda. And if you readers are wondering if he is everywhere like he is in this article, yes. Yes he is. You can not escape him.
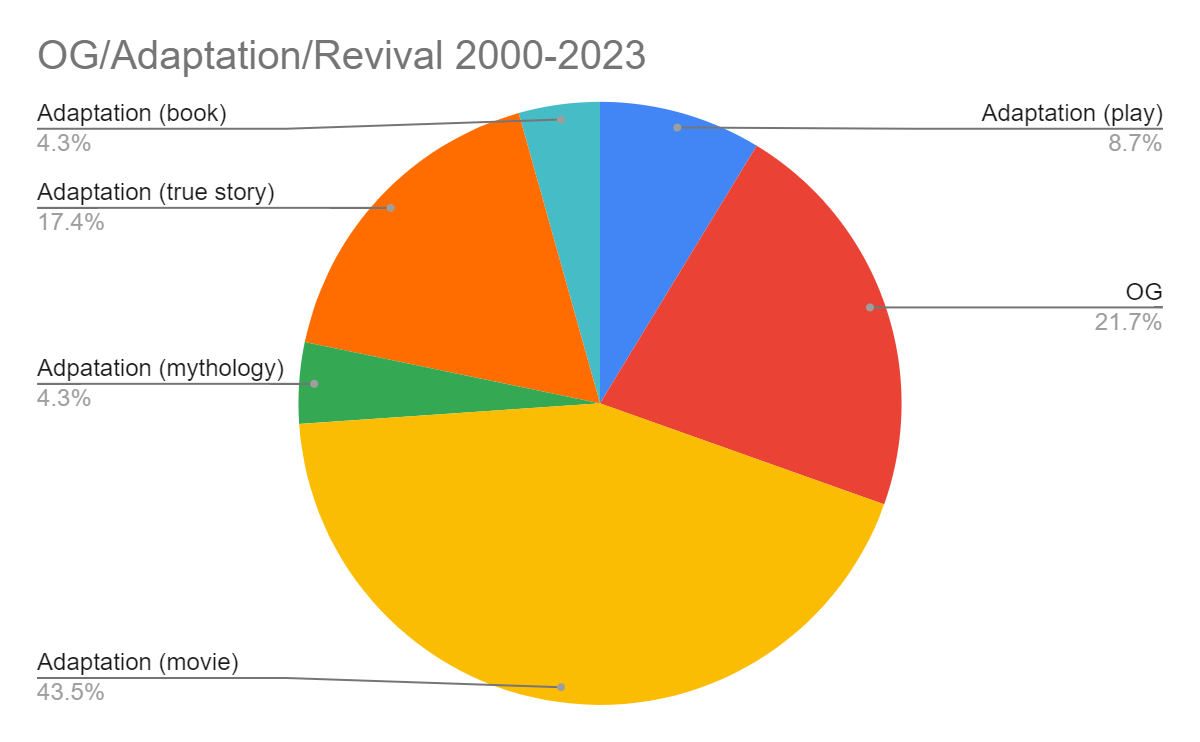
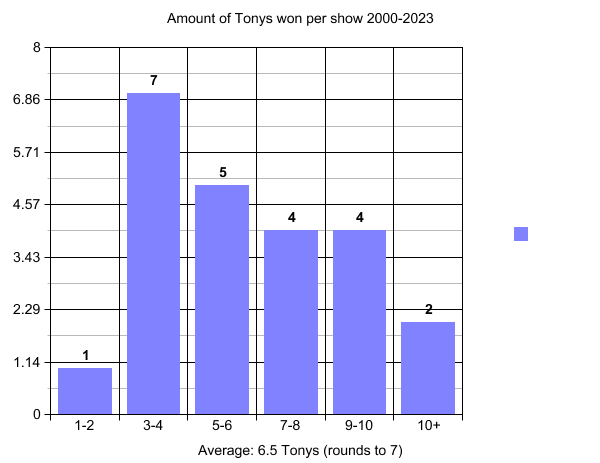
Now that we have all this information, we can finally answer the question that started this whole article-how do you win a Tony for Best Musical? Well, according to the data, you want a show that is an adaptation of a movie (any adaptation works, but movies seem to work the best), wins 3-4 Tonys, has a budget between $4 million and $14 million., ends up having 1,000-1,500 performances, has 13-14 known actors and 32-33 known production members in it, is in the contemporary style, has a profit over $300 million, with highest weekly grosses between $800,000-$1.8 million, has an average theater capacity of 88.01-91 percent, and with themes of identity and human connection. But most importantly, above everything else, you need Lin Manuel-Miranda.








Linda • Apr 7, 2024 at 11:06 am
Amazing analysis of a very complicated and multi faceted question!